Diary of an over obsessed ultrasound.money user
If you have this site open 24 hours a day, you accidentally run into some insights.
To start, there are 2 key aspects worth pointing out about ultrasound.money — the premier Ethereum gas/burn tracker and visualization website.
The design of this thing is absolutely beautiful. From the graphics to the user-friendliness of the site (while showing the most relevant information), this is a website worthy of the name.
I have the site pinned and look at it every day probably because it’s an endless source of hopium. Ethereum is right now always at the cusp of deflationary token economics — if only even slightly more sustained activity found itself onto the blockchain.
Number 2 is the hope to kickstart a bull market because the supply dynamics quickly turn quite favorable to Ethereum as it requires constant selling to maintain the current ETH price.
If Ethereum today burned ETH at the pace of the average gas price in January 2022 of ~120 gwei, this would result in a net negative issuance of 4 million ETH per year. This is ~3.3% of the supply.
As shown by the chart above, gas costs are down by nearly 90% from the peak. What people misunderstand here is that they think on-chain activity is 1/10th of what it was before. In practice, the difference between 10 to 100 gwei gas is probably only about a 2x increase in usage. Gas just acts in a way where it is very cheap for a long time until blocks are full, and that’s where it gets parabolically expensive once you’ve hit the wall.
The shorter-term trend is quite positive. Gas tends to rise when there’s (i) volatility, (ii) a general interest to speculate, or (iii) gas-intensive applications that fill blocks. None of these things are happening in earnest at the moment, yet it looks like Ethereum activity has bottomed and is on the rise.
Below is what the burn leaderboard looks like today. In a bull market, you’d expect to have the usual suspects such as Uniswap and OpenSea right at the top, but today both are below ETH and USDT transfers respectively. Arbitrum and Optimism have been slow climbers and will continue to do so (that is a bullish story of Ethereum scaling for another time).
The only “useless semi-Ponzi” gas spender on the list today is XEN — which has been responsible for as much as 15% of all gas spend recently.
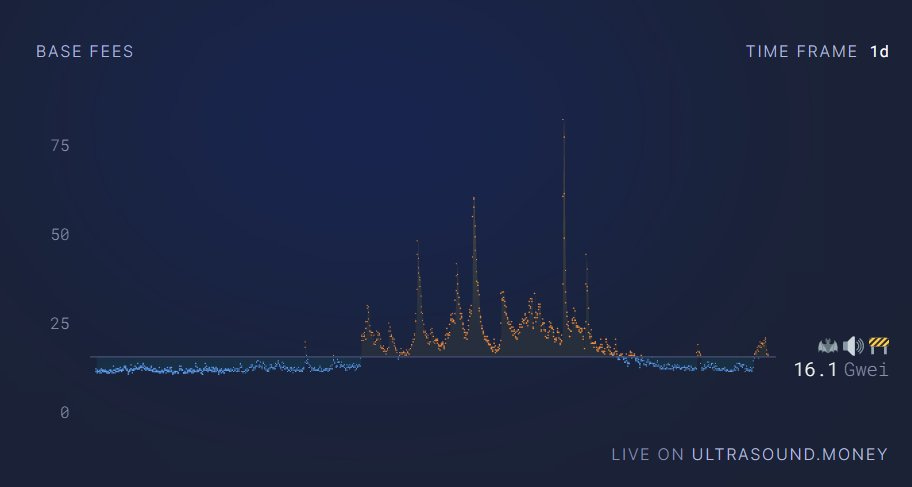
If you are following the charts each day, you’ll notice maybe 4-10 times per week a massive spike in gas from NFT minting. This is where gas reaches that beautiful 100+ gwei level. In a bull market, there are so many things going on that effectively all the time there’s something like an NFT mint going on leading to significantly higher gas prices.
The intra-daily story has become predictable.
When the US wakes up, ETH is deflationary. When they start going to sleep, ETH is not. Gas hovers around ~12 gwei during the night time, just below the magical number of 16.
Asia. C’mon, it’s time to step up and find something to do on-chain. If Asia was like the US, Ethereum would be quite deflationary just from that.
The big picture to keep in mind is that ETH net issuance without PoS would have been 1.09m (~$1.38 billion) in the past 90 days. Instead, it is a rounding error and goes negative if there's any on-chain activity.
Ethereum is tantalizingly close to a situation where the supply is down only and the supply-demand dynamics turn extremely favorable.
We just need to find that final push to turn the momentum over.
To end this post, shoutout to whoever is building this site and just the absolute confidence to put in this calculator which allows you to get a valuation of 201k per ETH by toggling the parameters.


